Hi,
I’ve recently just found out about Event Sourcing and EventStore (someone mentioned it in passing), and I have been going through the docs and having a play with it.
This seems really great, but I’m a bit lost in how you can visualise data?
Is it possible to connect EventStore to Grafana for example? What other tools out there can you use to visualise the data being logged?
(Not sure if I’ve fallen down a trap thinking of EventStore in this way, so any info in clearing this up for me would be very useful!)
Thanks in advance 
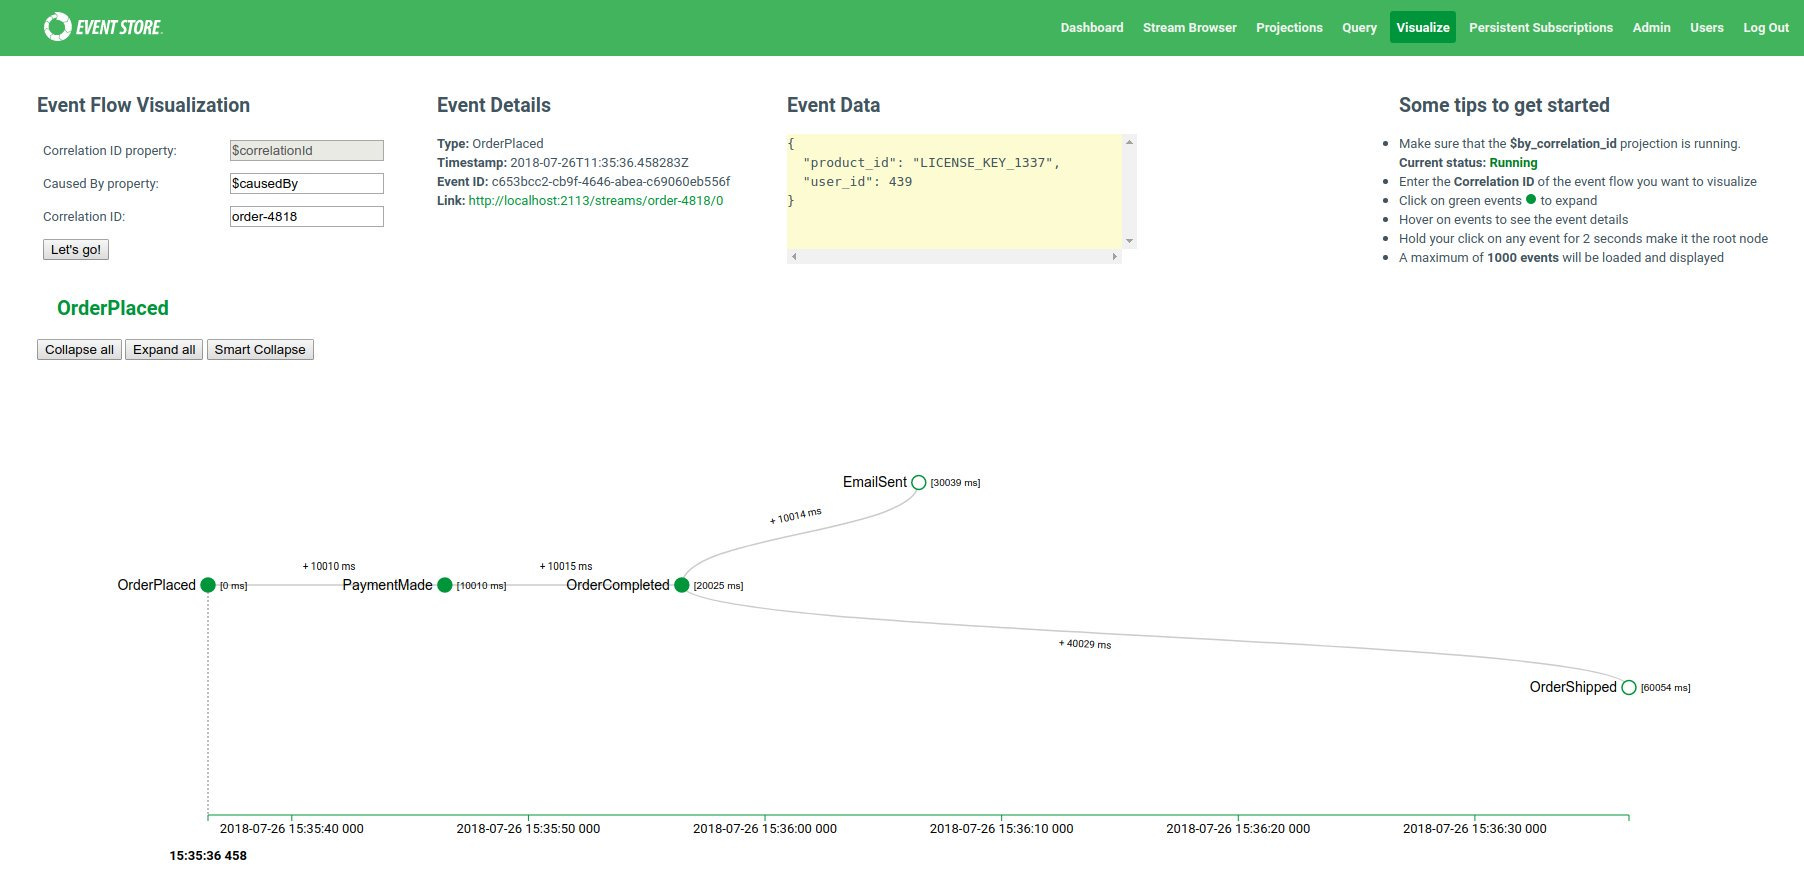
This would be a process running (multiple events) use $correlation-id and $causation-id
oh! they also live update as its running! https://www.youtube.com/watch?time_continue=32&v=uVmPhB_hVdg
Thanks for the response!
I think I might be missing a configuration setting somewhere perhaps as I cannot see the Visualise tab you have?
–run-projections=all (as example) and then run $by_correlation_id
Thanks for the response again!
Sorry for the simple question, but can you expand what you mean by <run $by_correlation_id> ?
I’ve enabled run-projections=all in the eventstore.conf:
RunProjections: All
ClusterSize: 1
But am unsure where I should run $by_correlation_id, and how that brings up the visulisation tab.
Thanks
Is that UI in 5.0.0? It looks fantastic!
Ah, apparently it’s in the commercial version. Would be awesome to see a list of features in the commercial version compared to the OSS version, as we’re considering upgrading.