Hello,
I am processing a modest amount of events through GES (about 100 events/sec), and I am getting the following from the logs:
[10684,46,21:07:22.055] SLOW QUEUE MSG [Projection Core #2]: UnwrapEnvelopeMessage - 2313ms. Q: 232/484.

[10684,48,21:07:22.173] SLOW QUEUE MSG [StorageReaderQueue #4]: ReadAllEventsForward - 246ms. Q: 0/0.

[10684,44,21:07:22.173] SLOW BUS MSG [bus]: UnwrapEnvelopeMessage - 2362ms. Handler: UnwrapEnvelopeHandler.

[10684,44,21:07:22.173] SLOW QUEUE MSG [Projection Core #0]: UnwrapEnvelopeMessage - 2362ms. Q: 315/601.

[10684,30,21:07:22.296] SLOW QUEUE MSG [StorageReaderQueue #2]: ReadAllEventsForward - 241ms. Q: 0/9.

[10684,45,21:07:25.067] SLOW BUS MSG [bus]: UnwrapEnvelopeMessage - 3140ms. Handler: UnwrapEnvelopeHandler.

[10684,45,21:07:25.067] SLOW QUEUE MSG [Projection Core #1]: UnwrapEnvelopeMessage - 3140ms. Q: 169/421.

[10684,46,21:07:25.117] SLOW BUS MSG [bus]: UnwrapEnvelopeMessage - 3061ms. Handler: UnwrapEnvelopeHandler.

[10684,46,21:07:25.117] SLOW QUEUE MSG [Projection Core #2]: UnwrapEnvelopeMessage - 3062ms. Q: 168/420.

[10684,44,21:07:25.171] SLOW BUS MSG [bus]: UnwrapEnvelopeMessage - 2992ms. Handler: UnwrapEnvelopeHandler.

[10684,44,21:07:25.171] SLOW QUEUE MSG [Projection Core #0]: UnwrapEnvelopeMessage - 2993ms. Q: 244/523.

[10684,45,21:07:28.136] SLOW BUS MSG [bus]: UnwrapEnvelopeMessage - 3068ms. Handler: UnwrapEnvelopeHandler.

[10684,45,21:07:28.136] SLOW QUEUE MSG [Projection Core #1]: UnwrapEnvelopeMessage - 3069ms. Q: 243/495.

[10684,46,21:07:28.163] SLOW BUS MSG [bus]: UnwrapEnvelopeMessage - 3045ms. Handler: UnwrapEnvelopeHandler.

[10684,46,21:07:28.163] SLOW QUEUE MSG [Projection Core #2]: UnwrapEnvelopeMessage - 3045ms. Q: 239/491.

[10684,44,21:07:28.227] SLOW BUS MSG [bus]: UnwrapEnvelopeMessage - 3051ms. Handler: UnwrapEnvelopeHandler.

[10684,44,21:07:28.227] SLOW QUEUE MSG [Projection Core #0]: UnwrapEnvelopeMessage - 3052ms. Q: 328/624.

[10684,45,21:07:29.856] SLOW BUS MSG [bus]: UnwrapEnvelopeMessage - 1719ms. Handler: UnwrapEnvelopeHandler.
Is there any documentation on what these warning mean? I can see some high times on here and wondered if it it was an issue of storage IOPS or is this normal?
Here is the details from the Projection concerned, it is only processing about 50 events/sec on average I think:
Stats

Events/sec	89.7

Buffered events	4815

Events processed	56683

Partitions cached	1

Reads in-progress	10

Writes in-progress	45

Write queue	33

Write queue (chkp)	0

Checkpoint status

Position	tbtc: 209728

Last checkpoint	tbtc: 209045
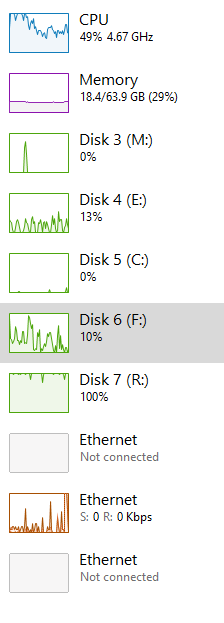
Attached is the disk the GES is running on, it only has GES data files on and is not used for any other purpose:
