Projections restarting from 65% after restart

Hi,

I’m running a single node event store. I’ve got

  • approximately 110.000.000 events
  • distributed over 251 streams
  • i’ve got the standard projections running
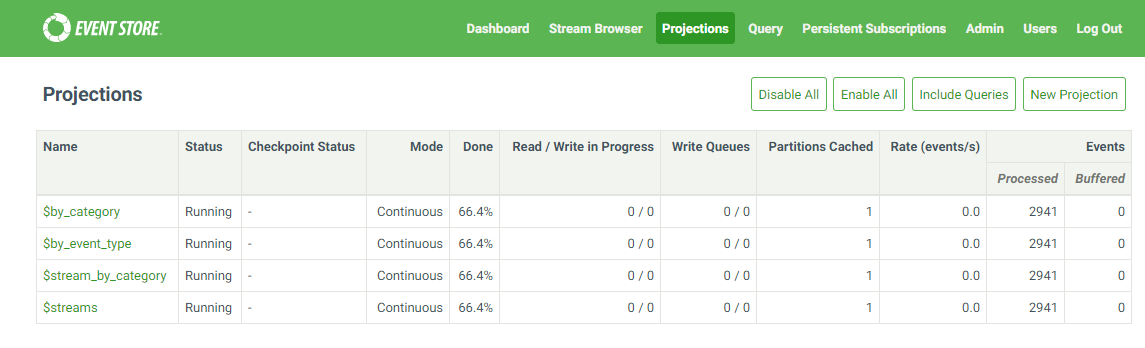
    I’ve inserted the events while the projections were running. Appending the events was a lot quicker than the projections. So after all the events were appended the projections took about an hour to catch up. After that the projections showed 100% done in the UI.

Now when I shut down the eventstore and spin it back up again the projections reset to 65.8% after which it start climbing again to 100% in about an hour burning 40% CPU (I7 laptop) and reading 10MB/s from SSD. In the process the ‘processed events’ entry immediately goed to 2941 and it stays on that number until 100% is reached. Every time i restart the server this repeats. I haven’t appended any events after the initial import.

This feels kind of strange. If I had to guess i would think it has something to do with checkpoints being written by the projections. If I look at the $all stream the end of the stream consists only of $projections-$master en $stats entries. So perhaps it’s wading through all the ‘meta’ messages and it doesn’t write checkpoints for that?!

Is this explainable? Or a bug?

kind regards,

Arno den Uijl

And if I look at the entries in the $projections-$master stream I see entries like below. I see the progress increasing but no change in the “lastCheckpoint” and “position”.

512765@$projections-$master
{
“id”: “9a82168a30e944f493bca250f6ee338b”,
“statistics”: {
“status”: “Running”,
“stateReason”: “”,
“name”: “$by_category”,
“projectionId”: 4,
“epoch”: -1,
“version”: 1,
“position”: “C:76345310514/P:76345310514”,
“progress”: 80.2,
“lastCheckpoint”: “C:76342725511/P:76342725511”,
“eventsProcessedAfterRestart”: 2941,
“checkpointStatus”: “”,
“partitionsCached”: 1,
“effectiveName”: “$by_category”,
“coreProcessingTime”: 7
}
}

512758@$projections-$master
{
“id”: “9a82168a30e944f493bca250f6ee338b”,
“statistics”: {
“status”: “Running”,
“stateReason”: “”,
“name”: “$by_category”,
“projectionId”: 4,
“epoch”: -1,
“version”: 1,
“position”: “C:76345310514/P:76345310514”,
“progress”: 80.0,
“lastCheckpoint”: “C:76342725511/P:76342725511”,
“eventsProcessedAfterRestart”: 2941,
“checkpointStatus”: “”,
“partitionsCached”: 1,
“effectiveName”: “$by_category”,
“coreProcessingTime”: 7
}
}

512755@$projections-$master
{
“id”: “9a82168a30e944f493bca250f6ee338b”,
“statistics”: {
“status”: “Running”,
“stateReason”: “”,
“name”: “$by_category”,
“projectionId”: 4,
“epoch”: -1,
“version”: 1,
“position”: “C:76345310514/P:76345310514”,
“progress”: 79.9,
“lastCheckpoint”: “C:76342725511/P:76342725511”,
“eventsProcessedAfterRestart”: 2941,
“checkpointStatus”: “”,
“partitionsCached”: 1,
“effectiveName”: “$by_category”,
“coreProcessingTime”: 7
}
}

``

76345310514
76342725511

The checkpoint is basically caught up which is why.

The difference is 2.585.003 and on restart it is going through 150 of the 434 chunks (38GB)

Somewhere this doesn’t resonate with my idea of ‘being caught up’. But since i’m just starting with working with the eventstore i assume I think about it in the wrong way. Can someone explain me where my reasoning fails?

That doesn’t sound like expected behaviour. Can you send a log?

Sure. I can mail them. What address?