We have a few clients that had their servers completely stalled due to the fact that GetEventStore (GES) ate up all their memory. We can reproduce the issue in-house both with version 1.0.1 and 2.0.1 of GES; they show the exact same behavior.
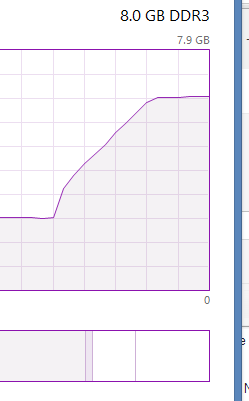
If we have a data-set with 13 chunks (each 256 MB) GES immediately allocates about 13*256 MB ~ 3.3 GB RAM while starting up. The memory is NOT released afterwards. As soon as we stop GES the memory is released. See attached screenshot of the Task Manager.
To run the tests we start GES from the command line with the following parameters
the situation does not change significantly. GES uses maybe 200 MB less.
Some of our customers have already 20+ chunks and their numbers are growing fast.
Usually the environment we use is a dedicated VM with 8 GB of RAM. In the above cases we could mitigate the situation by adding another 8 GB RAM but customers are concerned.
I feel like we do something fundamentally wrong but looking at the documentation (specifically the command line parameters) we do not see anything evident. Any help is appreciated
the screenshot you show probably includes file cache size and it is typical when you run event store. Typically windows does not release file cache memory unless it experience memory pressure. This is my guess only, however.
Do you use projections?
Could you inspect .NET related and memory related performance counters for event store process?
Do you see anything interesting in log files?
What is average size of your events?
What happens when your server goes down with memory out? Does the process crash?
Event 100 chunks should not be a problem on 8GB RAM
Ges is not allocating this memory. The file system is. This is completely normal as the file system is caching files. If you put it under pressure the file system gives up it’s caching. If you look at process memory ges is probably using about 800m by default configuration.
Btw in a newer branch we are also supporting memory mapped files but the same type of behaviour will be able to happen as the os will be swapping out the pages.
The servers went down and we had to increase memory to 16GB.
The eventstore process continues under memory pressure paging excessively. The other processes like w3wp report insufficient memory to process requests.
We will monitor the suggested counters tomorrow during the day
BTW shouldn’t we be able to set an upper limit to the memory consumption of GES similar to an RDBMS. IIRC Ayende does this also for Raven DB. Mongo DB that we use in production also is very humble regarding memory consumption.
We do not run any projections on GES. We have loads of different events and their size varies from tiny to maybe 1kB if big… but I do not really have any exact numbers there
If you want to avoid the initial use of memory set the don’t validate chunks option at startup. By default we will open all chunks at startup and validate their checksums. This also primes them into the file cache. As far as limiting things I believe you can do this in the windows file cache itself. What we are doing is just allowing the os to make such decisions.
Maybe it makes sense to allow for the explicit telling of the os to not cache things. In your situation this would prevent the chunks from ever going into the cache. I’m surprised however your file system cache doesn’t give up memory under pressure, here are some config points for it:
It would be useful if we covered some of these admin type things on a FAQ for administration. In principle it should not be a bad thing (windows file caches do this all the time on services however it can be scary to see the overall memory usage jump.
Can you setup the machine with two disks instead of one. Put es data on its own disk and disable caching. After you should see no memory usage going up. Does this make sense?
@Yuriy: We’re accessing GES via TCP interface only. @Greg: We’ll try all suggestions (by the way, the documentation about chunck cache and cached chunck size is confusion and/or contains mistakes https://github.com/eventstore/eventstore/wiki/Command-Line-Arguments. What is the difference between the two?)
No, it’s the Windows file cache causing the issue here, so there’s nothing we can do about it short of using unbuffered IO. The sysinternals tool is about the best you can do.