Hi,
We are using eventstore at our company. We have some basic monitoring setup like CPU/ RAM and hardrive monitoring.
Now what can we monitor of eventstore to see if it is healthy and how much load it is processing.
Thx
Hi,
We are using eventstore at our company. We have some basic monitoring setup like CPU/ RAM and hardrive monitoring.
Now what can we monitor of eventstore to see if it is healthy and how much load it is processing.
Thx
Hi,
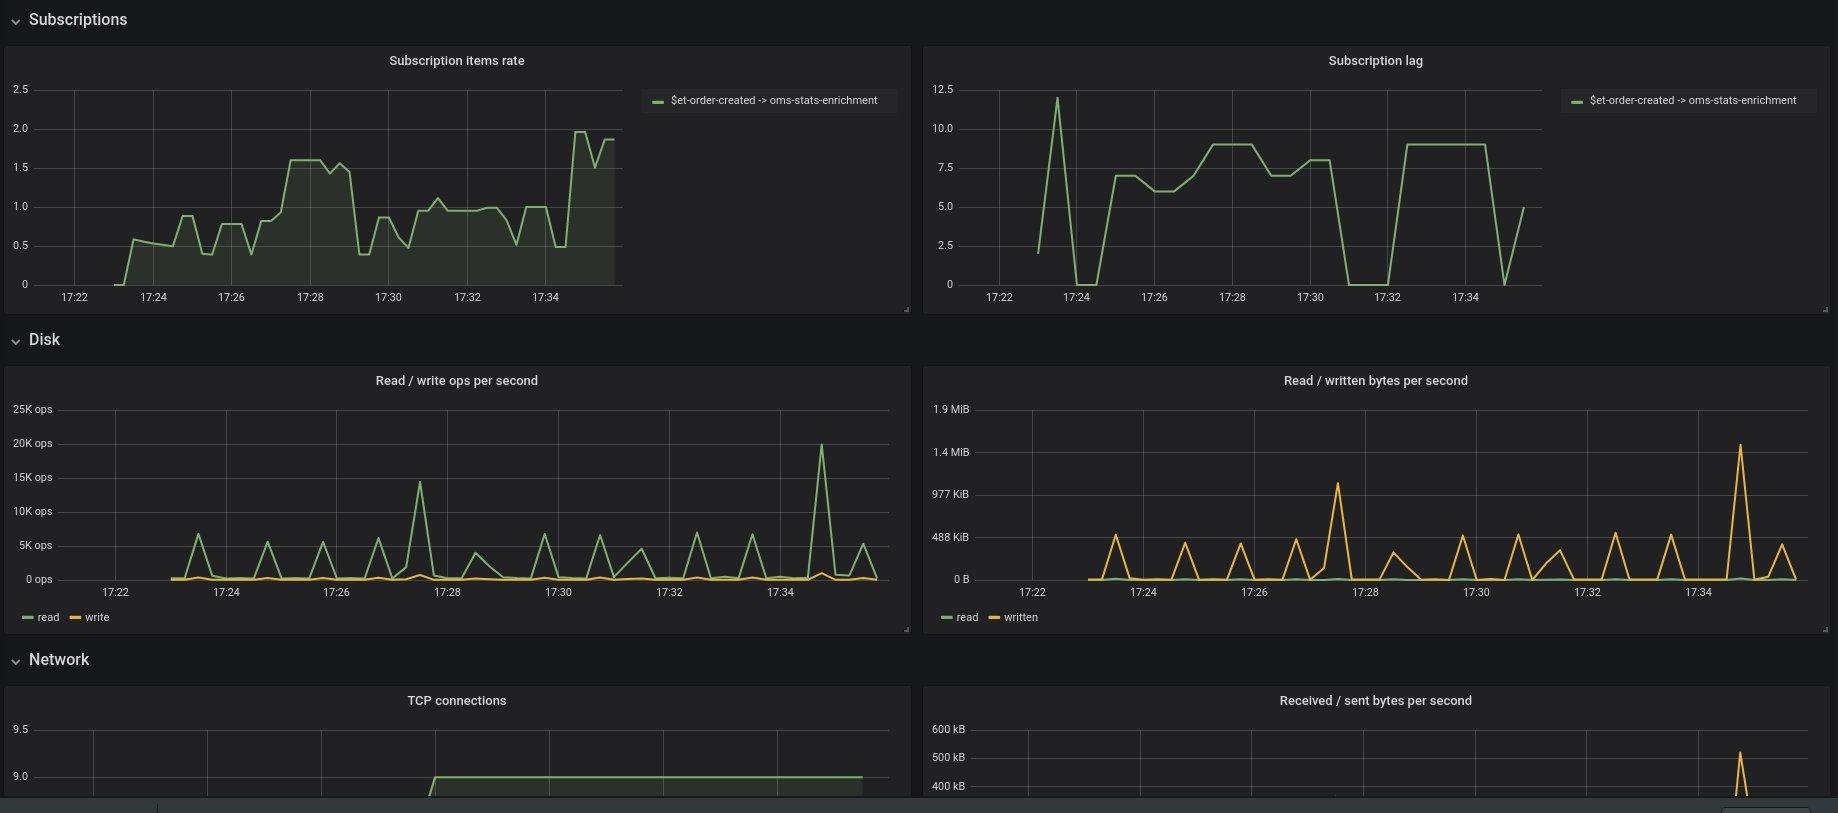
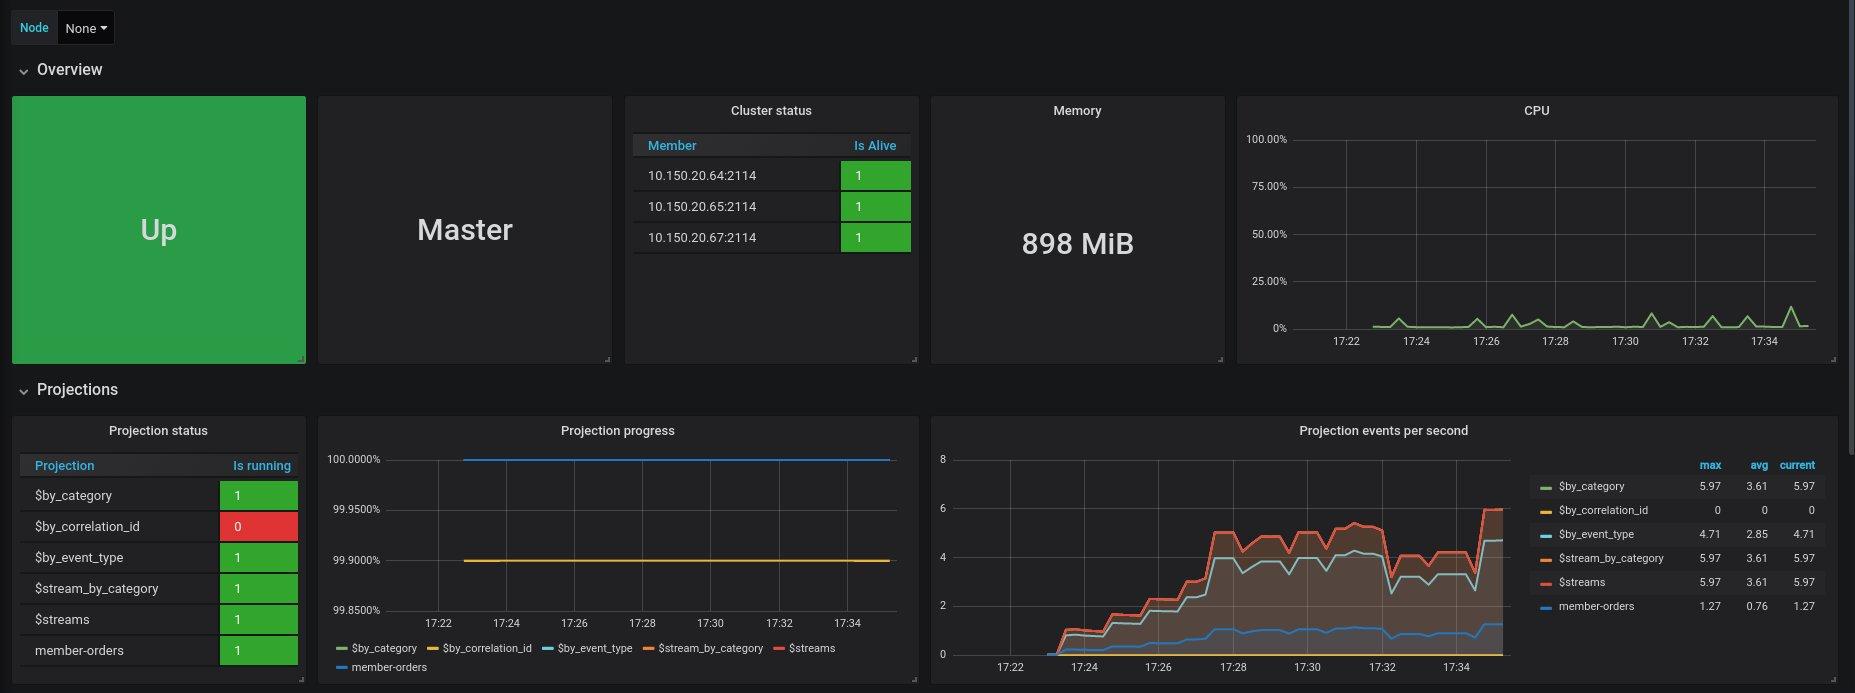
I don’t how you did it but at my current job, we are using a Prometheus exporter and use the exported metrics to provide a grafana dashboard and alerting.
Prometheus exporter: https://github.com/marcinbudny/eventstore_exporter
Grafana dashboard: https://grafana.com/grafana/dashboards/7673
Among those metrics, you can find persistent subscription lags for example.
So if you look there are a ton of statistics which can be received via HTTP (get on call)/written to stream/other tools (including just appending files!). These statistics are gathered on increment by ES itself for the stream (you can control frequency and/or get them on demand from outside). --stats-period-sec IIRC controls the frequency.
The real question is if you want the numbers from ES or from something else. On some things it would be decidedly better … say CPU usage … to have something else providing the information directly instead of getting it from ES (why should be obvious here :-D).