Hi there, I’ve been recording metrics from the stats stream in Eventstore using sensu and a plugin I’ve been working on, but I’m not sure exactly what it is that I’ve recorded. Specifically I’m confused by the totalItemsProcessed measurement from each queue. Specifically it seems to go both up and down on a regular basis, I’ve plotted it in Grafana to demonstrate.
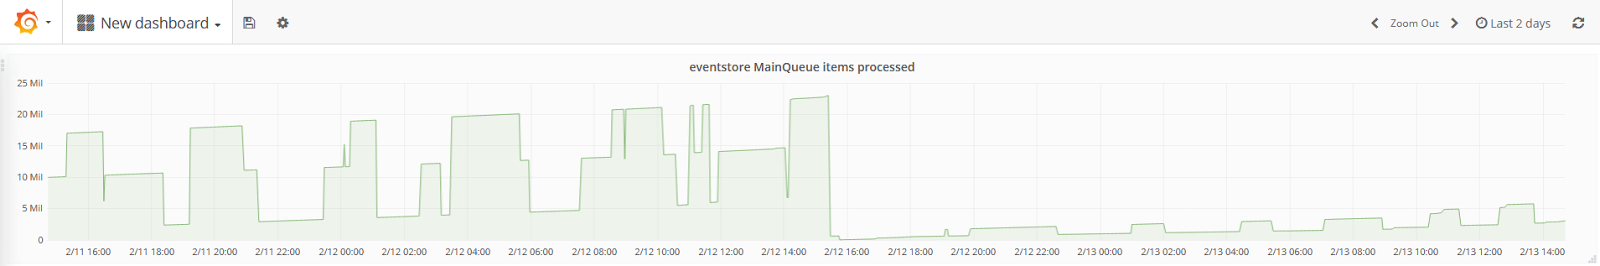
Based on my limited knowledge this looks wrong, it looks like there are three different perspectives on what the “items processed” reading might be and the perspective that’s being reported by the statistics stream is changing every few hours or minutes. That number of three doesn’t seem like a coincidence, there are three nodes in this cluster. I would have expected to see the number of items processed climbing gradually, possibly faster under load, and dropping to zero if an overflow occurs or if the data in eventstore is reset (which is what I think happened at 15:30 on the graph).
Since I was using a roundrobin subscription in sensu I thought that the measurement might be different depending on where sensu might have been calling the metric from, but confirmed that wasn’t the case by switching roundrobin subscriptions off. I’ve also confirmed that the reading is the same when taken from different servers in the cluster. I’ve also confirmed that this isn’t related to whichever node happens to be the master at the time. The master seems to be re-elected every few hours but far less frequently than we’re seeing spikes and troughs in the items processed metrics for each queue.
Why should the items processed by each queue appear like this?