Event Store stopping soon after Competing Consumers is being used

Event Store version 3.9.3
Ubuntu 16.04

Our Event Store is sitting happy for writes, but when we start using competing consumers, the RAM usage keep climbing up very fast, and eventually the process is terminated.

We have repeated this a few times, and each time the same result.

Can’t see any specific in the error log (I have attached it for reference) and we are at a lost as to what could be causing this.

When our service connects to Event Store, we have verified the number of connections matches up to what we expect.

Anyone offer any suggestions of things to try?

As a side note, this has only recently started happening and the only thing has been done to the ES which might make it upset is someone (me) decided to to a hard delete on the parked queue for one of the Stream / Group.

Eventually, I fixed this issue by creating a new Stream / Group and deleting the Group without a Parked Stream.

It might be nothing to do with this, but then again, maybe not.

The only option remaining to us is to trash the Event Store and start again, which we really don’t want to do.

Remote access to the ES is available if required.

Thanks in advance.

10.0.1.226-2113-cluster-node-err.log (13.2 KB)

What machine is this Event Store running on? RAM, CPU, DISK etc etc.

"As a side note, this has only recently started happening and the
*only* thing has been done to the ES which might make it upset is
someone (me) decided to to a hard delete on the parked queue for one
of the Stream / Group.
Eventually, I fixed this issue by creating a new Stream / Group and
deleting the Group without a Parked Stream."

This could be an issue but creating a new group would fix it. I am not
positive this case is handled will check.

Server specs:

Intel® Xeon® CPU E5-2676 v3 @ 2.40GHz

MemTotal: 4044968 kB

Disk: 20GB

Up until the last few days, there have been no problems like this, and have processed 100,00’s events (both writes and competing consumers)

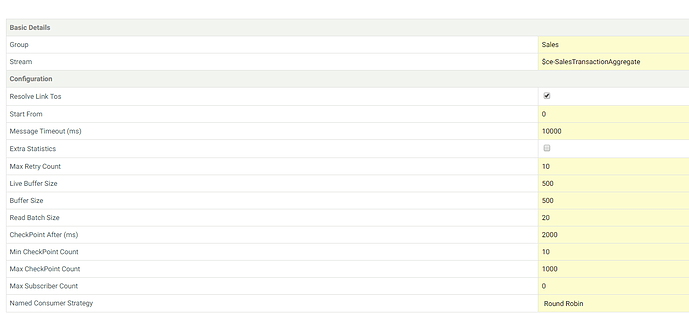
Also what are the settings on your group?

We have a lot of groups setup, and they should all be on the default settings (Max retry 10, 10000 timeout etc)
They all appear to be the same.

If the parked queue is missing, what does the ES actually try to do if it needs to park an event?

what are your buffer sizes configured to? with a large number of
subscriptions this could add up.

Greg,

Here is an example group (they all have the same settings)

At one stage, we had a around 125k messages backed up on the parked queue (why this happened is still a mystery, but that’s our issue)

Juts now the system is fairly quiet (I would guess < 100 events per hour just now) and still it keeps running away with memory.

How are yo measuring this?

You mean the traffic flowing just now? Just a rough guess, but we know where the feed of data is coming from and it’s unlikely to be much more.
The view on the Competing Consumers backs that up as well.

You can have a look quick look if you want?

We trashed our Event Store and started again, but unfortunately our Event Store keeps stopping.
We are quite worried about this now and we are struggling to keep our cloud system running for more than 5 minutes.

We are running V 3.9.3 and the RAM usage climbs up very fast, then the process is killed

There are no more than a 100 events per minute (probably a lot quieter than that)

In the error log, we have a a lot of this trace:

[PID:04187:031 2017.03.06 09:24:20.718 ERROR QueuedHandlerAutoRes] Error while processing message EventStore.Projections.Core.Messages.ReaderSubscriptionMessage+CommittedEventDistributed in queued $

System.ArgumentException: complete TF position required

Parameter name: committedEvent

at EventStore.Projections.Core.Services.Processing.EventByTypeIndexPositionTagger.IsMessageAfterCheckpointTag (EventStore.Projections.Core.Services.Processing.CheckpointTag previous, EventStore.P$

at EventStore.Projections.Core.Services.Processing.ReaderSubscriptionBase.ProcessOne (EventStore.Projections.Core.Messages.CommittedEventDistributed message) [0x00000] in :0

at EventStore.Projections.Core.Services.Processing.ReaderSubscription.Handle (EventStore.Projections.Core.Messages.CommittedEventDistributed message) [0x00000] in :0

at EventStore.Projections.Core.Services.Processing.HeadingEventReader.DistributeMessage (EventStore.Projections.Core.Messages.CommittedEventDistributed message) [0x00000] in :0

at EventStore.Projections.Core.Services.Processing.HeadingEventReader.Handle (EventStore.Projections.Core.Messages.CommittedEventDistributed message) [0x00000] in :0

at EventStore.Projections.Core.Services.Processing.EventReaderCoreService.Handle (EventStore.Projections.Core.Messages.CommittedEventDistributed message) [0x00000] in :0

at EventStore.Core.Bus.MessageHandler`1[EventStore.Projections.Core.Messages.ReaderSubscriptionMessage+CommittedEventDistributed].TryHandle (EventStore.Core.Messaging.Message message) [0x00000] i$

at EventStore.Core.Bus.InMemoryBus.Publish (EventStore.Core.Messaging.Message message) [0x00000] in :0

at EventStore.Core.Bus.InMemoryBus.Handle (EventStore.Core.Messaging.Message message) [0x00000] in :0

at EventStore.Core.Bus.QueuedHandlerAutoReset.ReadFromQueue (System.Object o) [0x00000] in :0

[PID:04187:031 2017.03.06 09:24:24.951 ERROR ProcessingStrategySe] The AllSales projection failed to process an event.

Handler: EventStore.Projections.Core.Services.v8.DefaultV8ProjectionStateHandler

Event Position: C:1587148855/P:1587148855; Vme.Eposity.SalesTransactions.DomainEvents.SalesTransactionCompletedEvent: -1; Vme.Eposity.SalesTransactions.DomainEvents.SalesTransactionSummaryAddedEven$

Message:

Failed to compile script. Script execution terminated. Timeout expired. (1)

EventStore.Projections.Core.v8.Js1Exception: Failed to compile script. Script execution terminated. Timeout expired. (1)

at EventStore.Projections.Core.v8.CompiledScript.CheckResult (IntPtr scriptHandle, Boolean terminated, Boolean disposeScriptOnException) [0x00000] in :0

at EventStore.Projections.Core.v8.QueryScript.ExecuteHandler (IntPtr commandHandlerHandle, System.String json, System.String[] other, System.String& newSharedState) [0x00000] in <filename unknown$

at EventStore.Projections.Core.v8.QueryScript+c__AnonStorey1.<>m__3 (System.String json, System.String[] other) [0x00000] in :0

at EventStore.Projections.Core.v8.QueryScript.Push (System.String json, System.String[] other) [0x00000] in :0

at EventStore.Projections.Core.Services.v8.V8ProjectionStateHandler.ProcessEvent (System.String partition, EventStore.Projections.Core.Services.Processing.CheckpointTag eventPosition, System.Stri$

at EventStore.Projections.Core.Services.Processing.EventProcessingProjectionProcessingPhase.ProcessEventByHandler (System.String partition, EventStore.Projections.Core.Messages.CommittedEventRece$

at EventStore.Projections.Core.Services.Processing.EventProcessingProjectionProcessingPhase.SafeProcessEventByHandler (System.String partition, EventStore.Projections.Core.Messages.CommittedEvent$

[PID:04187:029 2017.03.06 09:25:02.123 ERROR QueuedHandlerAutoRes] —!!! VERY SLOW QUEUE MSG [Projections Master]: RegularTimeout - 7984ms. Q: 0/2.

We have a custom projection running, which in our heads anyway, isn’t really doing that much:

var processEvent = function (s, e) {

if (e.data) {
    if (e.data.MetaData && e.data.MetaData.organisationId) {
        var streamName = 'AllSales_' + e.data.MetaData.organisationId.replace(/-/gi, "");

        linkTo(streamName, e);
    }
}

};

fromAll()
.when({
‘Vme.Eposity.SalesTransactions.DomainEvents.SalesTransactionCompletedEvent’: processEvent,
‘Vme.Eposity.SalesTransactions.DomainEvents.SalesTransactionSummaryAddedEvent’: processEvent,
‘Vme.Eposity.SalesTransactions.DomainEvents.SalesTransactionLineAddedEvent’: processEvent,
‘Vme.Eposity.SalesTransactions.DomainEvents.SalesTransactionStartedEvent’: processEvent
});

``

Our guess just now is some sort of resource leak, that runs away with all the servers RAM, and then the OS decides to Kill the process.

Can anyone help?
The parked message queue is just a stream, it is not held in memory
etc. Normally messages are parked either because retries are expired
or a client naks a messages telling it to be parked.

I believe the timeout issue and the checkpoint exception are both
resolved in 4.0.

We also have another custom projection running:

fromCategory(‘SalesTransactionAggregate’)
.when({
$init: function(state, ev) { return { count: 0 } },
‘Vme.Eposity.SalesTransactions.DomainEvents.SalesTransactionSummaryAddedEvent’: function(state, e)
{
var streamName = ‘AllSales_’ + e.data.MetaData.organisationId.replace(/-/gi, “”);
var eventDate = new Date(e.data.CompletionDateTime);
var month = eventDate.getMonth() + 1;
var day = eventDate.getDate().toString().paddingLeft(“00”);

        var monthlyStream = streamName + '_' + eventDate.getFullYear() + month.toString().paddingLeft("00");
        var dailyStream = streamName + '_' + eventDate.getFullYear() + month.toString().paddingLeft("00") + day;

        linkTo(monthlyStream, e);
        linkTo(dailyStream, e);
    }
});

String.prototype.paddingLeft = function (paddingValue) {
return String(paddingValue + this).slice(-paddingValue.length);
};

``

Greg,

We just disabled our two custom projections, and the RAM and CPU have dropped dramatically.

Not sure if the stability issue has been resolved, but it’s currently running.

Is there anything fundamentally messed up with our two projections that could be causing the ES to get upset?

Died again :frowning:

Bang goes that theory

What is the memory usage that you are seeing?

The server is 4gb, and just now ( we have restarted it) it is sitting around 30% usage but steadily starts to climb.
If we were bombarding the system I could understand the RAM climbing so quickly, but the system is barely being used just now ( < 100 events per minute)

How are you measuring this? There is more than one value for memory
usage. Generally with default settings I would expect it to sit around
1gb