I was doing some benchmarking with the C# client and I found that doing single event appends to a single stream with 10000 events takes about 230 seconds. However, by batching the same events in groups of 1000, I can append everything in less than 1 second. Why would there be such a difference even when running both server (docker container) and client on the same server with minimal latency?
Because, of the concurrency checks, updates to memory structures and indexes that need to happen , acking the append to the client : 10000 times or only 10 times
The message over the wire will be different as well 10000 headers and such instead of 10
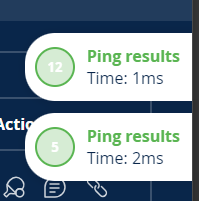
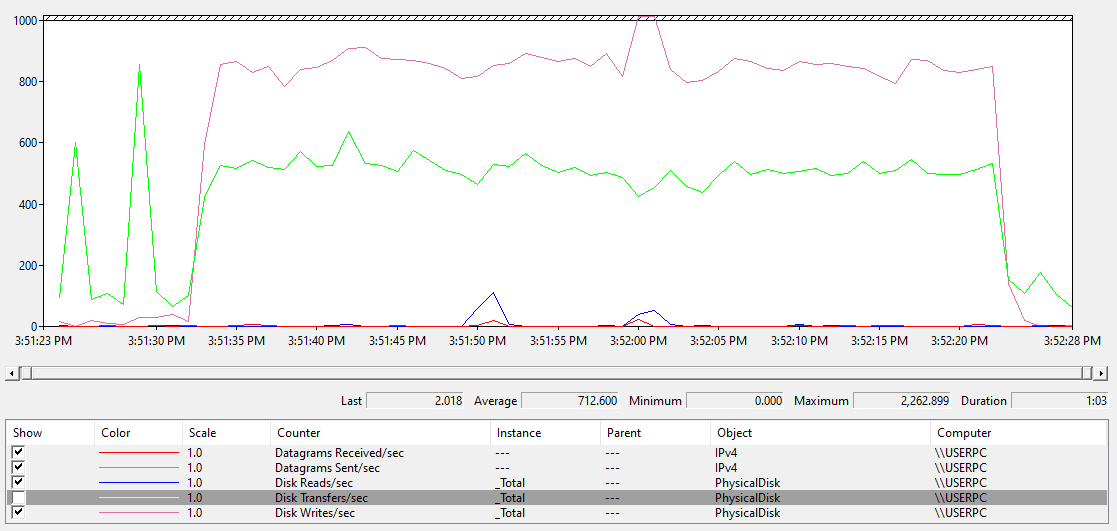
I’ve tried using the windows native version instead of docker, added Defender exclusions to EventStore folder, ran with all app optimizations, and disabled projections, and still I’m only getting ~100 appends/sec. These are small events (~100 bytes) and I have an SSD. My CPU usage in the Navigator always shows <1% and the Performance Monitor is showing only ~800 transfers/sec. The Navigator show that the ping is ~1-2 mS but shouldn’t this be much lower since I’m running on the same system? What is the typical events per seconds I could expect on a reasonably powerful workstation laptop?

what does is your benchmark code looks like ?
    public static async Task DoAppends(int batchsize=1, int numevents=1000)
    {
        var eventbuffer = new List<EventData>();
        using var client = new EventStoreClient(_esSettings);
        var uuidlist = new List<Uuid>();
        Stopwatch sw = new();
        sw.Start();
        for (int i = 0; i < numevents; i++)
        {
            uuidlist.Add(Uuid.NewUuid());
        }
        Console.WriteLine($"UUID generation took {sw.ElapsedMilliseconds}mS");
        sw.Restart();
        for (var i = 0; i < numevents; i++)
        {
            var eventBytes = Encoding.UTF8.GetBytes(JsonConvert.SerializeObject(new
            {
                Id = i,
                SomeProperty =
                    "somewhat long event property that babble on in order to generate a somewhat typical event size for my application",
            })).AsMemory();

            eventbuffer.Add(new EventData(uuidlist[i], "TestEventType", eventBytes));
            if (eventbuffer.Count() == batchsize)
            {
                await client.AppendToStreamAsync($"TestStream", StreamState.Any, eventbuffer);
                eventbuffer.Clear();
            }
        }
        Console.WriteLine($"Appends took {sw.ElapsedMilliseconds}mS {sw.ElapsedMilliseconds / (double)numevents}"); //24,074mS
    }
the code is looking at the APpend for the whole batch .
The following looks at the append average time.
If you run this you’ll see that the average append time for
batchsize=1 numevents=1000
batchsize=1000 numevents=1000
are quite different than what you might expect with the test you’ve done so far.
It might be useful to explain a bit more what you are trying to achieve and how your system will work to look at what type of benchmark your need to perform.
      int numberOfAppends = 0;
    var stopWatch = new Stopwatch();


    for (var i = 0; i < numevents; i++)
    {
        var eventBytes = Encoding.UTF8.GetBytes(JsonConvert.SerializeObject(new
        {
            Id = i,
            SomeProperty =
                "somewhat long event property that babble on in order to generate a somewhat typical event size for my application",
        })).AsMemory();

        eventbuffer.Add(new EventData(uuidlist[i], "TestEventType", eventBytes));

        if (eventbuffer.Count == batchsize)
        {
            stopWatch.Start();
            await client.AppendToStreamAsync("TestStream", StreamState.Any, eventbuffer);
            stopWatch.Stop();

            numberOfAppends++;
            eventbuffer.Clear();
        }
    }
    Console.WriteLine($"Appends took {sw.ElapsedMilliseconds}mS {sw.ElapsedMilliseconds / (double)numevents}"); //24,074mS
    Console.WriteLine($"Average append time : {stopWatch.ElapsedMilliseconds/ (double)numberOfAppends}ms/append, time spend in append = {stopWatch.ElapsedMilliseconds}ms ");

}
