with windows you need to limit file cache
https://technet.microsoft.com/en-us/sysinternals/bb897561
This comes up quite a bit. Is it possible to detect this configuration from code and put a warning in the logs?
No, I haven’t been able to figure out the problem.
Paul,
You had change in the memory usage?
We seem to be experiencing something similar here.
As a test yesterday, I started a new ES (3.8) and let it run. There was frequent traffic and memory usage sat around 500mb.
Just come into the office and usage is now on 2.8gb, and there would have been almost no traffic over night (it’s a for shop that opens / closes 9 til 5 ish)
The box this is running on has 3.5 gb ram so once the box is struggling, the process gets terminated.
This is almost a daily occurrence for us now.
Windows? Is the process actually using the memory or windows file cache?
This! In dev, I’m running es 3.8 with projections with 256 MB of RAM just fine
Yeah Greg, it’s Windows.
We are only using Task Manager as a guide (EventStore.ClusterNode was sitting around 2.5gb before the command window gets closed automatically).
There doesn’t appear to be anything else on the server doing that much.
We have been using the same Event Store database for a while and I thought I had maybe managed to cause the problem myself, so last night that’s why I installed a new instance and let it run.
Since I restarted the EventStore (about half an hour ago) the RAM usage has went from around 200mb to 490mb and we have processed < 100 events.
I have the $by_category projection and also a custom projection.
As suggested earlier, I have this argument set on startup --cached-chunks=0
490mb is totally normal (up to about 700-800 is normal), by default
512mb of this is off heap memory for two chunk files. The extra is
probably windows file caching which by default will use all the memory
available on the machine. There are tools like cacheset that allow you
to cap the amount of memory that windows will use.
The usage since my last post is now 766mb.
Would you expect the memory usage to be jumping that high in the short space of time (and relatively low amount of traffic).
If that’s expected, then maybe that isn’t a problem for us.
It’s just a little worrying how the memory usage creeps up into gb’s when the system seems pretty quiet.
I will have a look at cacheset, thanks.
You need to separate file cache from actual memory usage process
manager lumps everything together. Jumping to 766 is as I said
reasonably normal. Event Store on small dbs (up to say 50gb) usually
uses about 700-800mb of memory. You can lower this by using -c 0 which
will lower it significantly but also has performance impact.
It’s now at 1.2gb and my DB is 256mb (and process just over 2000 events)
I will try and understand the file cache from memory usage sicne there is obviously something I don’t fully appreciate here.
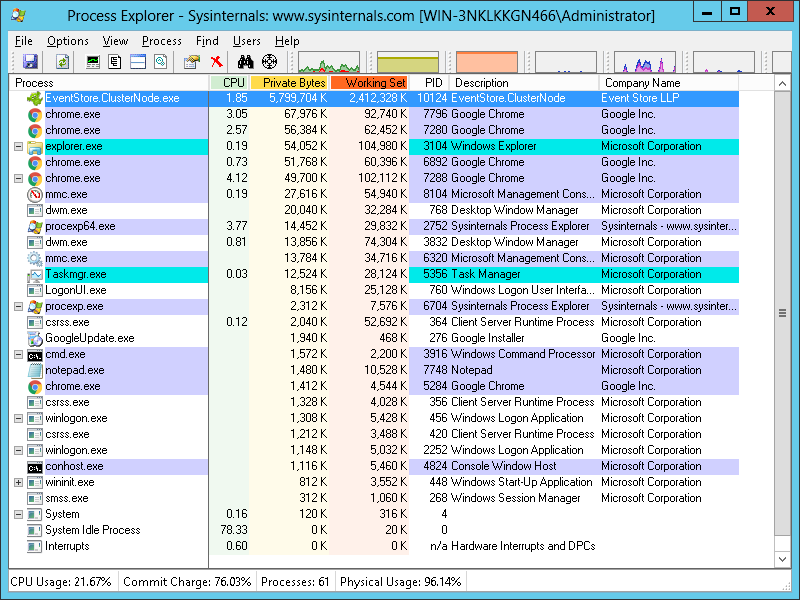
You can use process explorer to look in more depth
Here is the output from ProcessExplorer.
Going by the usual pattern we have seen, this will be killed shortly.
This node is sitting idle correct? You mention 2000 events total.
What is your config?
It’s version 3.8 extracted, and my startup is as follows:
“C:\Users\Administrator\Desktop\Event Store\EventStore.ClusterNode.exe” --db “C:\Users\Administrator\Desktop\Event Store\db” --log “C:\Users\Administrator\Desktop\Event Store\logs” --run-projections=all --skip-db-verify --cached-chunks=0
The shop is doing for sales just now so the traffic has increased, but still relatively low amounts of traffic.
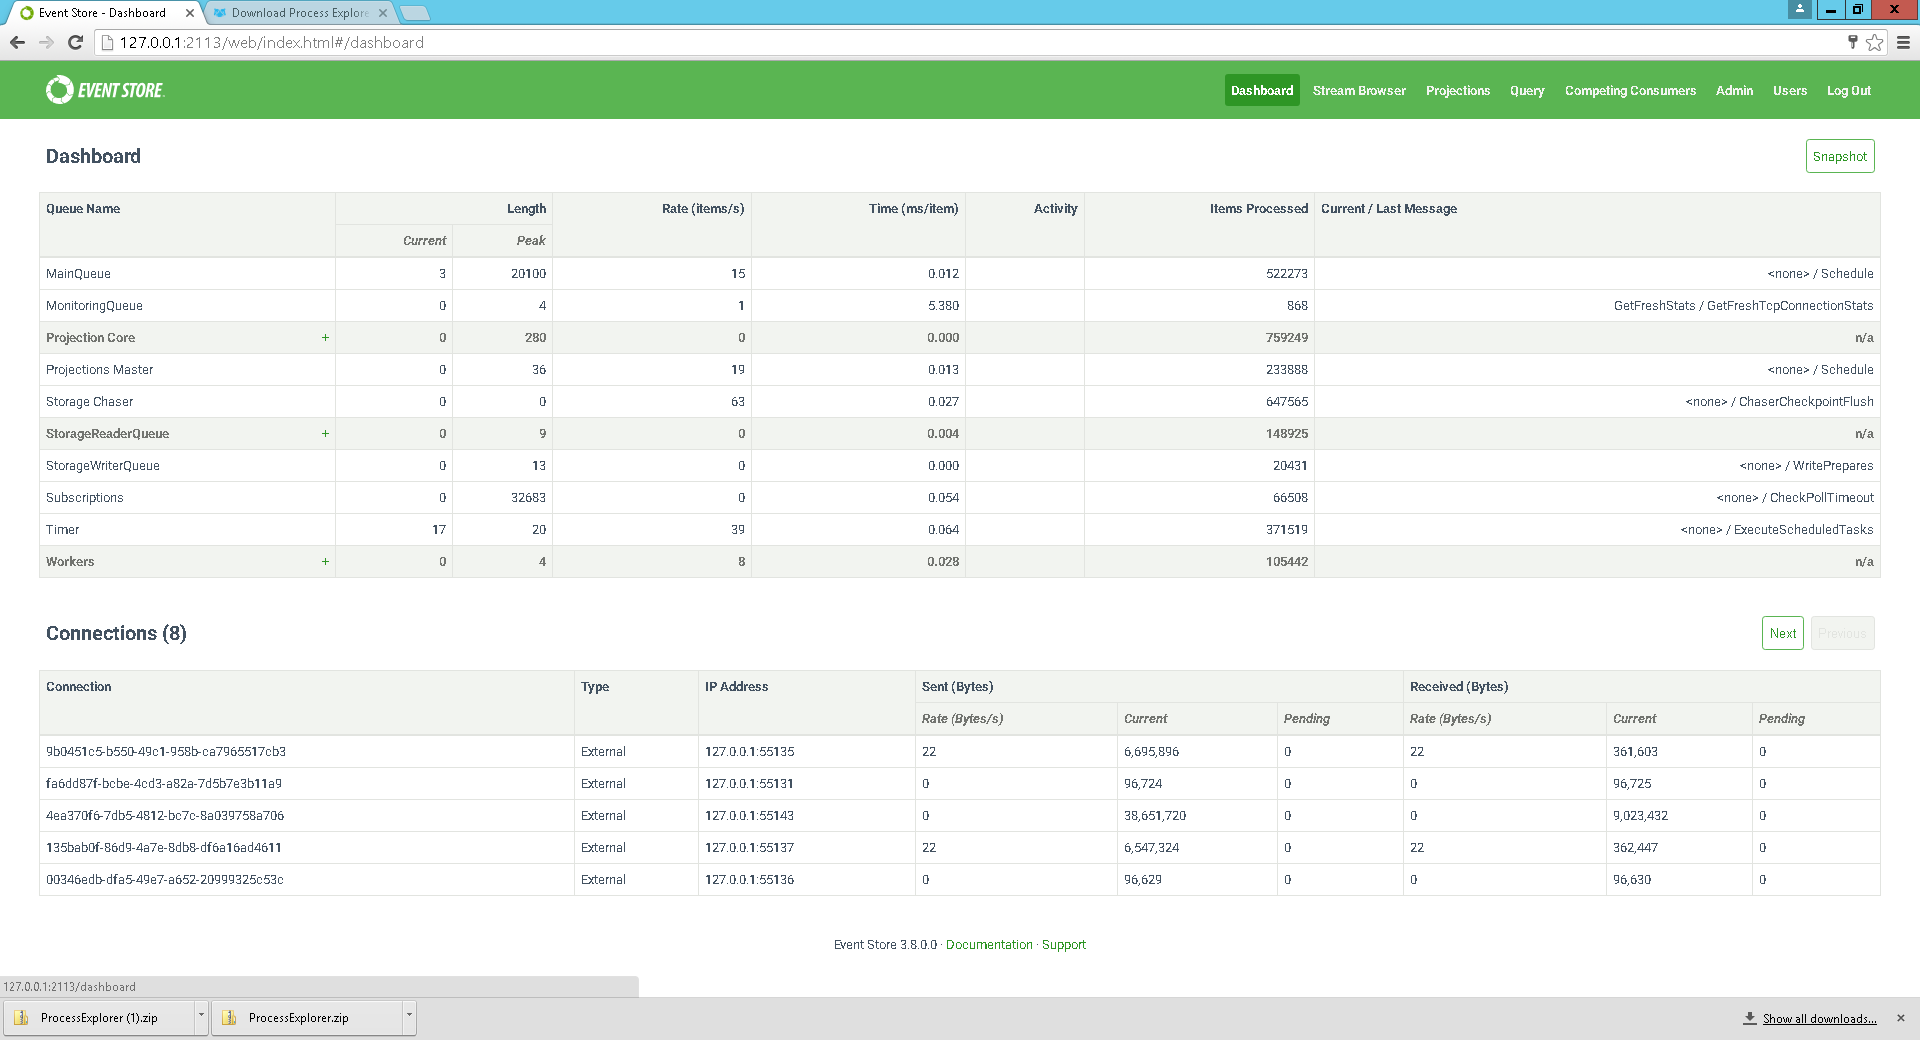
Since your last restart I am seeing 150k reads and 20k writes.
the --cached-chunks=0 probably is not needed (and unrelated).
Are your events very big etc? How are you accessing just TCP or http as well?
We use TCP for all the writing / reading.
As for event size, I don’t know what a “big” event would be, but here is an example of one:
{
  "$type": "Tahoe.Eposity.SalesTransactions.DomainEvents.SalesTransactionStartedEvent, Tahoe.Eposity.SalesTransactions.DomainEvents",
  "TransactionId": "1853126",
  "AggregateId": {
    "$type": "Tahoe.DomainDrivenDesign.AggregateId, Tahoe.DomainDrivenDesign",
    "Value": "64b79018-331e-42df-b0b1-3f247ae2a012"
  },
  "TransactionNumber": 57,
  "AggregateVersion": {
    "$type": "Tahoe.DomainDrivenDesign.AggregateVersion, Tahoe.DomainDrivenDesign",
    "Value": 0
  },
  "OperatorId": 68,
  "EventId": "ca296017-e864-437a-912b-2b7570945827",
  "EventTimestampAsString": "7/26/2016 10:56:24 AM +00:00",
  "TillNumber": 9,
  "MetaData": {
    "$type": "System.Collections.Generic.Dictionary`2[[System.String, mscorlib],[System.String, mscorlib]], mscorlib",
    "organisationId": "5c9b010b-bbcc-4f14-b81e-290f3125413c",
    "storeId": "75aeb4cc-9972-421e-bac9-0812c642f93a"
  }
}
Gut feeling is 20k writes is probably ok with the amount of traffic we have had through today, but the 150k reads seems very high.
I have attached another screenshot with the reader expanded.
There probably is something for us to look at in that area, but even if there was a lot of reads, would you think this has anything to do with the memory usage?
Now at 2.5gb btw

It shouldn't (nobody else has issues with issuing say 150k reads, 150k
is actually tiny :))
remember that you also have $statistics running which does a write
occasionally about the status of the node. Also these events aren't
big so should not be an issue.
That’s it died again.
Not sure where to go with this at the moment.
Anyone got any suggestions?
Since its localized to your machine there isnt much we can do in terms
of debugging it. There are windows nodes out there that having been
running for years. A good start might be to figure out what is using
memory in the process. Do you get the same thing without projections?
What do the projections look like?